Now that MapleCTF is over, let’s have talk about the infrastructure. Let’s talk about what went alright and not so good. You can find the repository for all of the infrastructure here.
Introduction
The entire infrastructure was hosted on GCP (thank you Google for the sponsorship) and brought up using Terraform. This makes it easy to bring up and down from one command, but it also useful for disaster recovery. All of the challenges services related to this CTF were hosted on a zonal GKE cluster.
As it is with any project on the cloud, you need to focus on the following:
- Cost optimization - Use no more than you need to, every resource you use has a cost
- Secure - This is a CTF after all, the last thing anyone wants is for your infrastructure to be exploited
- Scalability - Use as much as you need. There is varying load in any application, in this case the most load would happen at the start of the CTF
- Robustness - The infrastructure should stay up even when some things fail (challenges in particular)
- Maintainability - Anyone can make changes in the console, but what is your source of truth? IaC
GKE Cluster
I chose to run this on a zonal cluster due to a variety of factors. Because I wrote this infrastructure in Terraform, in the unlikely event of a GKE zone going down, I can easily move this to another zone with minimal downtime with just a few commands. GKE free tier also gives you one free zonal or autopilot cluster per month, so I took advantage of that.
The cluster was setup on two node pools. CTFd, MySQL, and Redis ran on one, while the challenges and monitoring stack ran on the other. This was to provide separation throughout the CTF.
I chose to make this a private cluster to reduce our surface area for attacks. As a result of this, all challenges and services that needed to be exposed to the public were behind GCP load balancers.
Costs
Given my choice to use a zonal cluster, the control plane was free. I only paid for the nodes that were up during the CTF, which I will go into later.
Networking
Everything related to the CTF it’s own VPC, while other services like our bastion ran on a VPC separate from the cluster but peered to it. There was firewalling between the two VPC’s so communication was mostly into the GKE cluster, with certain exceptions.
Costs
Having all of our services behind load balancers increased cost, but it was negligible due to the low volume of traffic. Given that there were about 20 hosted challenges, based on GCP load balancer pricing, you can estimate load balancer pricing as follows:
First 5 forwarding rules @ $0.025/hour x 5 = $0.125/hour
Per additional forwarding rule @ $0.01/hour * 15 = $0.15/hour
Inbound data processed by load balancer @ $0.008/GB (negligible)
Outbound data processed by load balancer @ $0.008/GB (effective October 1, 2022, irrelevant for us)
Our real networking costs was just under $22 ($21.99) with most of the cost being in GCS. Networking is a cost you cannot predict as you generally do not know how much traffic you will generate. Given the relatively low volume of traffic CTF’s generate, this did not pose an issue to us. A partial cost breakdown is shown below (only items with non-zero cost are shown).

All prices shown are in USD.
CTFd
CTFd and it’s related services (MySQL and Redis) ran on it’s own node pool on GKE, using e2-highcpu-32 instances. There were a few issues I wanted to talk about.
I thought 1 instance of CTFd was enough, but it soon proved to be too little. I used the recommended number of workers to start off with, which is defined as (2 x $num_cores) + 1 on the gunicorn documentation. I had to up the node pool max size as well as the number of replicas from 1 to 3. After that, it was relatively smooth.
One issue we had was that there were a multitude of updates to our CTFd container, each of which required a restart. Initially, I had an error in my manifest where the update strategy was set to Recreate instead of RollingUpdate, which meant that on restart, every pod in the deployment would terminate on restart. I fixed that soon after.
don’t make the same mistake I did
Use this
spec:
  strategy:
    type: RollingUpdate
instead of
spec:
  strategy:
    type: Recreate
MySQL and Redis
To bring up the supporting services CTFd depends on, I used bitnami helm charts to deploy instances of MySQL and Redis. I configured them to use my existing secrets.
MySQL was deployed with a single master and 3 secondaries in case of any issues related to the database going down. With Redis, I had 3 masters and 3 secondaries for redundancy. With MySQL, I could easily pull backups from the secondaries and recreate our database in the event anything happens, like a GKE persistent volume getting deleted for whatever reason.
Challenges
Challenges ran on their own node pool, using e2-highcpu-16 insances. It took two nodes to run all of the hosted challenges, with 2 replicas of each.
Each challenge was deployed behind it’s own load balancer. I created a jinja2 template for hosted challenges so that challenge developers could create their own manifests, with separate templates for layer 4 and layer 7 challenges so GKE can create the right load balancers.
Each challenge had it’s own horizontal pod autoscaler (HPA). The baseline was set to scale up on <50% CPU usage based on the resource requests as defined in each challenge deployment, but that proved to be insufficient. Due to the challenges being finished extremely late, I was unable to have challenges be load tested. This resulted in the provisioned resource limits as defined in the challenge deployment spec being far too high for most challenges, resulting in the overprovisioning of resources. This also results in the HPA being useless in it’s base configuration.
Here is an example challenge deployment:
Challenge Deployment
apiVersion: apps/v1
kind: Deployment
metadata:
  name: bookstore
  labels:
    app: bookstore
  namespace: challenges
spec:
  selector:
    matchLabels:
      app: bookstore
  replicas: 2
  template:
    metadata:
      labels:
        app: bookstore
    spec:
      affinity:
        nodeAffinity:
          requiredDuringSchedulingIgnoredDuringExecution:
            nodeSelectorTerms:
              - matchExpressions:
                  - key: node_pool
                    operator: In
                    values:
                      - maplectf-node-pool
      enableServiceLinks: false
      automountServiceAccountToken: false
      containers:
        - name: bookstore
          image: gcr.io/maplectf-2022/bookstore:latest
          imagePullPolicy: Always
          ports:
            - containerPort: 3000
              name: http
          securityContext:
            allowPrivilegeEscalation: false
            privileged: false
          resources:
            limits:
              cpu: "500m"
              memory: "1Gi"
Challenge Updates
It was fairly easy to deploy challenge updates. Given that the hosted challenges were containerized with a Jenkins job that built containers on commit, updating hosted challenges was as simple as pushing a commit to the challenge repo and then restarting said challenge after the container was built and pushed to GCR.
Disabling Service Links and not mounting your Kubernetes Service Account Token
For those who are not aware, you can disable service links and the mounting of the service account token. Given that GKE implements role-based access control (RBAC) by default and given that most of the flags were in the challenges themselves, having a leaked token wouldn’t do much harm. The default service permissions for a service account has no permissions, other than the permissions granted for an unauthenticated user. In clusters that give permission to unauthenticated users or bind any permissions to default service accounts, having a leaked service account token could potentially be very bad. We also did not need service links for our challenges, so that was also disabled.
Disabling these would do no harm in our case, and you can do so by adding the following for a deployment:
spec:
  template:
    spec:
      enableServiceLinks: false
      automountServiceAccountToken: false
Compute Engine
Bastion (and dockerd)
I ran a single VM on compute engine: a bastion. Given that our GKE worker nodes were private, in the event I needed to access any of the nodes, I could do so using this bastion. This instance ran on a e2-highcpu-2.
It also served as our dockerd for our Jenkins instance. I didn’t want to run docker-in-docker on a Kubernetes cluster (it’s difficult and creates many security concerns).
Costs
The cost for running the bastion and GKE worker nodes came up to be around $140 ($141.73). All of our nodes ran on E2 instances, reducing cost while providing the required performance.

All prices shown are in USD.
CI/CD
GitHub Actions
I had 3 actions on this repository that ran on runners I hosted on my VM’s. Any updates to the cluster or docker images related to infrastructure were automatically applied on each commit. This ensures consistency as well as a history of any changes to the infrastructure. You can find more information on how to apply GitOps to your own workflows here.
I ran any jobs that would update the infrastructure here instead of on Jenkins because I did not want jobs that change infrastructure actually run on the infrastructure alone. Think about it, if the infrastructure broke, then how would you run the job?
Here is my action for updating the cluster:
Update Cluster
name: Update cluster

# Controls when the workflow will run
on:
  push:
    branches:
    - main
  pull_request:
    branches:
    - main

  # Allows you to run this workflow manually from the Actions tab
  workflow_dispatch:

# Allows one build at a time
concurrency:
  group: $-$

# A workflow run is made up of one or more jobs that can run sequentially or in parallel
jobs:

  update-infra:
    # The type of runner that the job will run on
    runs-on: self-hosted

    # Steps represent a sequence of tasks that will be executed as part of the job
    steps:
      # Checks-out your repository under $GITHUB_WORKSPACE, so your job can access it
      - uses: actions/checkout@v3

      - name: Install kubectl
        uses: Azure/setup-kubectl@v3

      - name: Install kubeval
        run: |
          wget https://github.com/instrumenta/kubeval/releases/latest/download/kubeval-linux-amd64.tar.gz
          tar xf kubeval-linux-amd64.tar.gz
          sudo cp kubeval /usr/local/bin

      - name: Setup Terraform
        uses: hashicorp/setup-terraform@v1

      - name: Authenticate to Google Cloud
        uses: 'google-github-actions/auth@v0'
        with:
          credentials_json: '$'

      - name: 'Set up gcloud SDK'
        uses: 'google-github-actions/setup-gcloud@v0'
        with:
          version: '397.0.0'

      - name: Check gcloud
        run: |
          set -x
          gcloud info

      - name: Get GKE Credentials
        uses: 'google-github-actions/get-gke-credentials@v0'
        with:
          cluster_name: 'maplectf-prod'
          location: 'us-west1-b'

      - name: Terraform Init
        id: tfinit
        run: terraform -chdir=$GITHUB_WORKSPACE/2022int/tf/prod init

      - name: Terraform Format
        id: tffmt
        run: terraform -chdir=$GITHUB_WORKSPACE/2022int/tf/prod fmt -check

      - name: Terraform Validate
        id: tfvalidate
        run: terraform -chdir=$GITHUB_WORKSPACE/2022int/tf/prod validate

      - name: Terraform Plan
        id: tfplan
        run: terraform -chdir=$GITHUB_WORKSPACE/2022int/tf/prod plan -input=false -no-color
        continue-on-error: true

      - name: Update Pull Request with Terraform
        uses: actions/github-script@v6.1.0
        if: github.event_name == 'pull_request'
        env:
          PLAN: "$"
        with:
          github-token: $
          script: |
            const output = `#### Terraform Format and Style 🖌\`$\`
            #### Terraform Initialization ⚙️\`$\`
            #### Terraform Plan 📖\`$\`
            #### Terraform Validation 🤖\`$\`

            <details><summary>Show Plan</summary>

            \`\`\`\n
            ${process.env.PLAN}
            \`\`\`

            </details>

            *Pushed by: @$, Action: \`$\`*`;

            github.rest.issues.createComment({
              issue_number: context.issue.number,
              owner: context.repo.owner,
              repo: context.repo.repo,
              body: output
            })

      - name: Terraform Plan Status
        if: steps.tfplan.outcome == 'failure'
        run: exit 1

      - name: Terraform Apply
        if: github.ref == 'refs/heads/main' && github.event_name == 'push'
        run: |
          set -x
          terraform -chdir=$GITHUB_WORKSPACE/2022int/tf/prod apply -auto-approve -input=false

      - name: Lint Yamls
        id: yamllint
        run: yamllint -f github $GITHUB_WORKSPACE/2022int/kubernetes

      - name: Lint Kubernetes Manifests
        id: kubelint
        run: kubeval -d $GITHUB_WORKSPACE/2022int/kubernetes --ignore-missing-schemas

      - name: Update Pull Request with Kubernetes
        uses: actions/github-script@v6.1.0
        if: github.event_name == 'pull_request'
        env:
          KUBELINT: "$"
        with:
          github-token: $
          script: |
            const output = `#### Kubernetes Linting 🖌\`$\`

            <details><summary>Show Linting</summary>

            \`\`\`\n
            ${process.env.KUBELINT}
            \`\`\`

            </details>

            *Pushed by: @$, Action: \`$\`*`;

            github.rest.issues.createComment({
              issue_number: context.issue.number,
              owner: context.repo.owner,
              repo: context.repo.repo,
              body: output
            })

      - name: Apply Kubernetes Manifests
        if: github.ref == 'refs/heads/main' && github.event_name == 'push'
        run: |
          set -x
          kubectl apply -Rf $GITHUB_WORKSPACE/2022int/kubernetes
Jenkins
I made a Jenkins instance just for this CTF using this bitnami helm chart. We had pipelines for building our challenges and CTFd. I configured the chart to use a custom jenkins-agent image.
I needed to install docker on the image as well as configure the image to use our dockerd instance on the bastion located at bastion.internal.ctf.maplebacon.org. The Dockerfile is as follows:
Dockerfile
FROM jenkins/inbound-agent

USER root

# docker install
RUN apt-get update && apt-get install -y \
    ca-certificates \
    curl \
    gnupg \
    lsb-release \
    sudo \
    iproute2

RUN mkdir -p /etc/apt/keyrings
RUN curl -fsSL https://download.docker.com/linux/debian/gpg | gpg --dearmor -o /etc/apt/keyrings/docker.gpg

RUN echo \
    "deb [arch=$(dpkg --print-architecture) signed-by=/etc/apt/keyrings/docker.gpg] https://download.docker.com/linux/debian \
    $(lsb_release -cs) stable" | tee /etc/apt/sources.list.d/docker.list > /dev/null

RUN apt-get update && apt-get install -y docker-ce docker-ce-cli containerd.io docker-compose-plugin

RUN usermod -aG docker jenkins

USER jenkins

# remote docker
ENV DOCKER_HOST=ssh://jenkins@bastion.internal.ctf.maplebacon.org
Logging
EFK Stack
For debugging purposes, I brought up an Elasticsearch, Fluentd, and Kibana (EFK) stack using the bitnami helm charts for Elasticsearch and Fluentd. It’s analagous to the common ELK stack which consists of Elasticsearch, Logstash, and Kibana. Challenge authors could implement logging, and look for anything using Kibana, meaning that challenge authours wouldn’t need to install gcloud and kubectl to look at logs.
I created a custom image for fluentd and configured fluentd to parse and send logs in cri format. My Dockerfile and configuration for Fluentd is as follows:
Fluentd Dockerfile
FROM bitnami/fluentd

RUN fluent-gem install 'fluent-plugin-parser-cri' --no-document
Fluentd Configmap
---
apiVersion: v1
kind: ConfigMap
metadata:
  name: fluentd-config
  namespace: monitoring
data:
  fluentd.conf: |-
    ################################################################
    # HTTP input for the liveness and readiness probes
    <source>
      @type http
      bind 0.0.0.0
      port 9880
    </source>

    # This source gets all logs from local docker host
    @include pods-kind-fluent.conf
    @include forward-fluent.conf
  pods-kind-fluent.conf: |-
    <source>
      @type tail
      read_from_head true
      tag kubernetes.*
      path /var/log/containers/*.log
      pos_file /var/log/fluentd-containers.log.pos
      exclude_path ["/var/log/containers/fluent*"]
      <parse>
        @type cri
        merge_cri_fields false
        time_key time
        keep_time_key true
      </parse>
    </source>
    <filter kubernetes.**>
      @type kubernetes_metadata
      @id filter_kube_metadata
      kubernetes_url "#{ENV['FLUENT_FILTER_KUBERNETES_URL'] || 'https://' + ENV.fetch('KUBERNETES_SERVICE_HOST') + ':' + ENV.fetch('KUBERNETES_SERVICE_PORT') + '/api'}"
      verify_ssl "#{ENV['KUBERNETES_VERIFY_SSL'] || true}"
      ca_file "#{ENV['KUBERNETES_CA_FILE']}"
      skip_labels "#{ENV['FLUENT_KUBERNETES_METADATA_SKIP_LABELS'] || 'false'}"
      skip_container_metadata "#{ENV['FLUENT_KUBERNETES_METADATA_SKIP_CONTAINER_METADATA'] || 'false'}"
      skip_master_url "#{ENV['FLUENT_KUBERNETES_METADATA_SKIP_MASTER_URL'] || 'false'}"
      skip_namespace_metadata "#{ENV['FLUENT_KUBERNETES_METADATA_SKIP_NAMESPACE_METADATA'] || 'false'}"
    </filter>
  forward-fluent.conf: |-
    # Forward all logs to the aggregators
    <match **>
      @type forward
      <server>
        host fluentd-aggregator.monitoring.svc.cluster.local
        port 24224
      </server>
      <buffer>
        @type file
        path /opt/bitnami/fluentd/logs/buffers/logs.buffer
        flush_thread_count 2
        flush_interval 5s
      </buffer>
    </match>
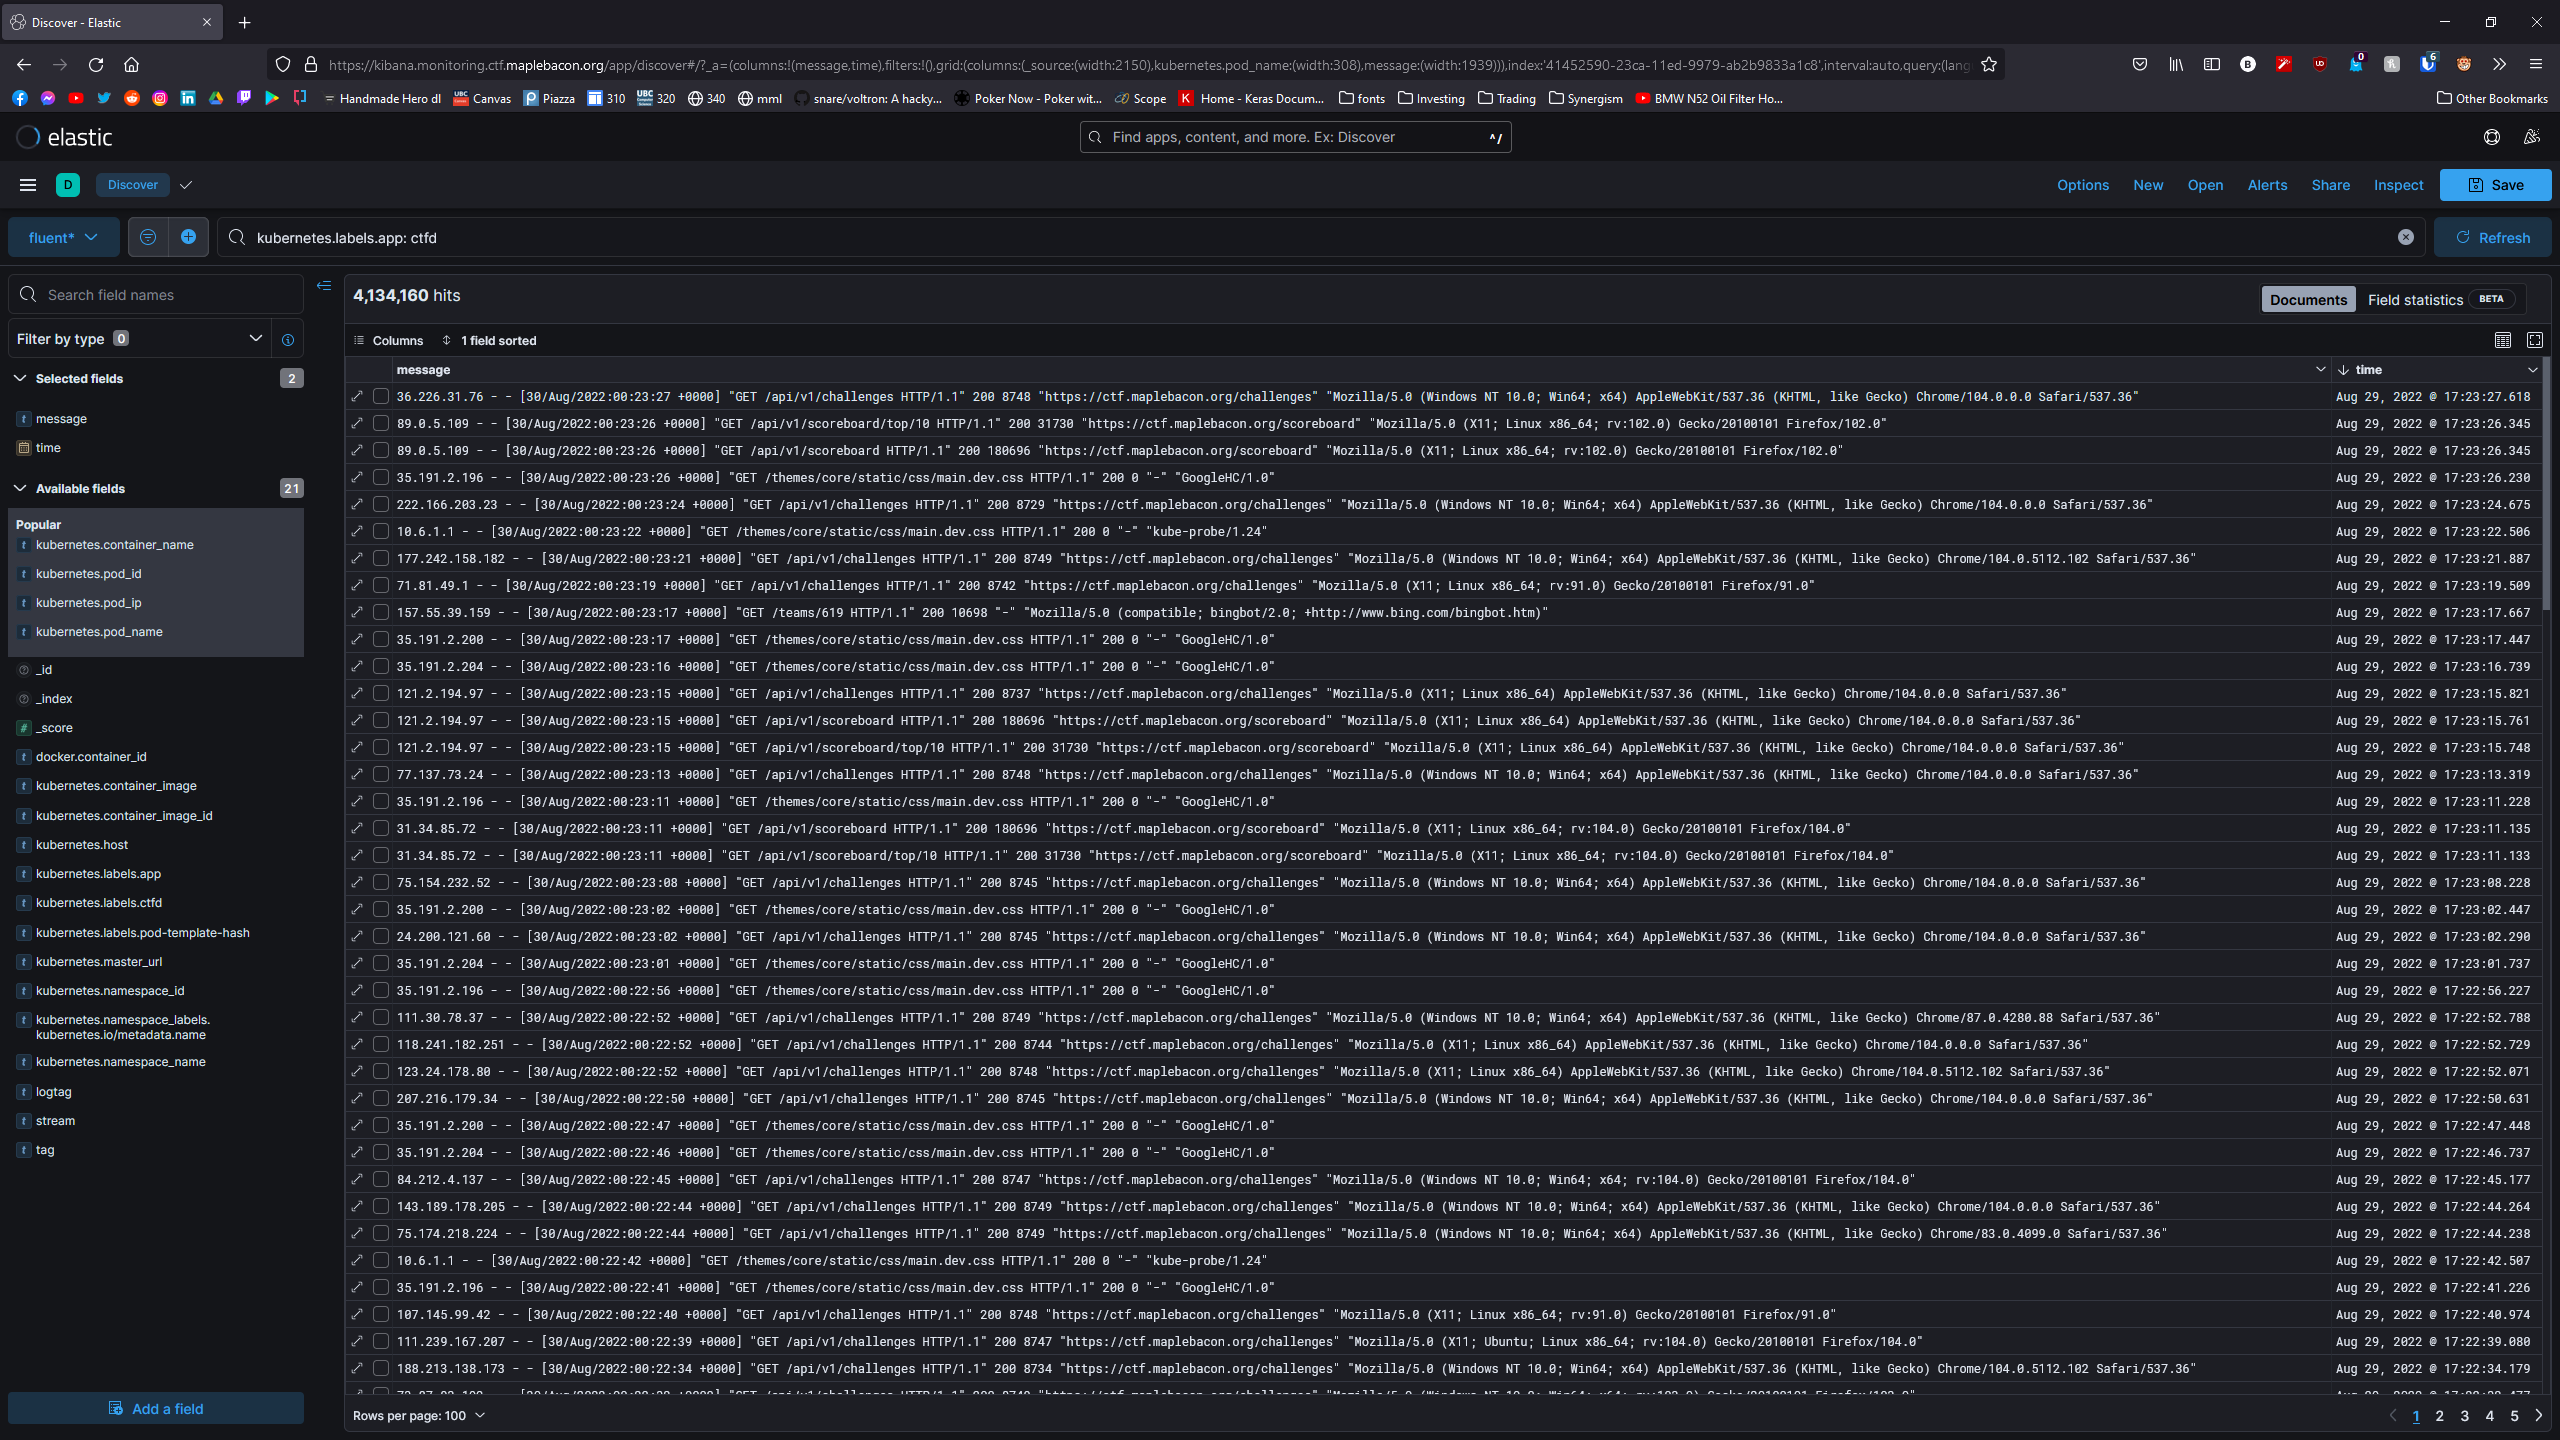
Kubernetes logs are ephemeral, they will get deleted of a pod gets deleted. Having this stack up provides logs that persist throughout the life of this stack, enabling us to look at what’s going on at a per-challenge basis and look for anything suspicious.
The following example shows me looking at CTFd logs:

Prometheus and Grafana
I also brought up prometheus on the GKE cluster using the community helm chart. Grafana was brought up with the use of the bitnami helm chart.
Grafana is a very useful visualization tool and I find it much more useful when compared to the GKE metrics that are provided.

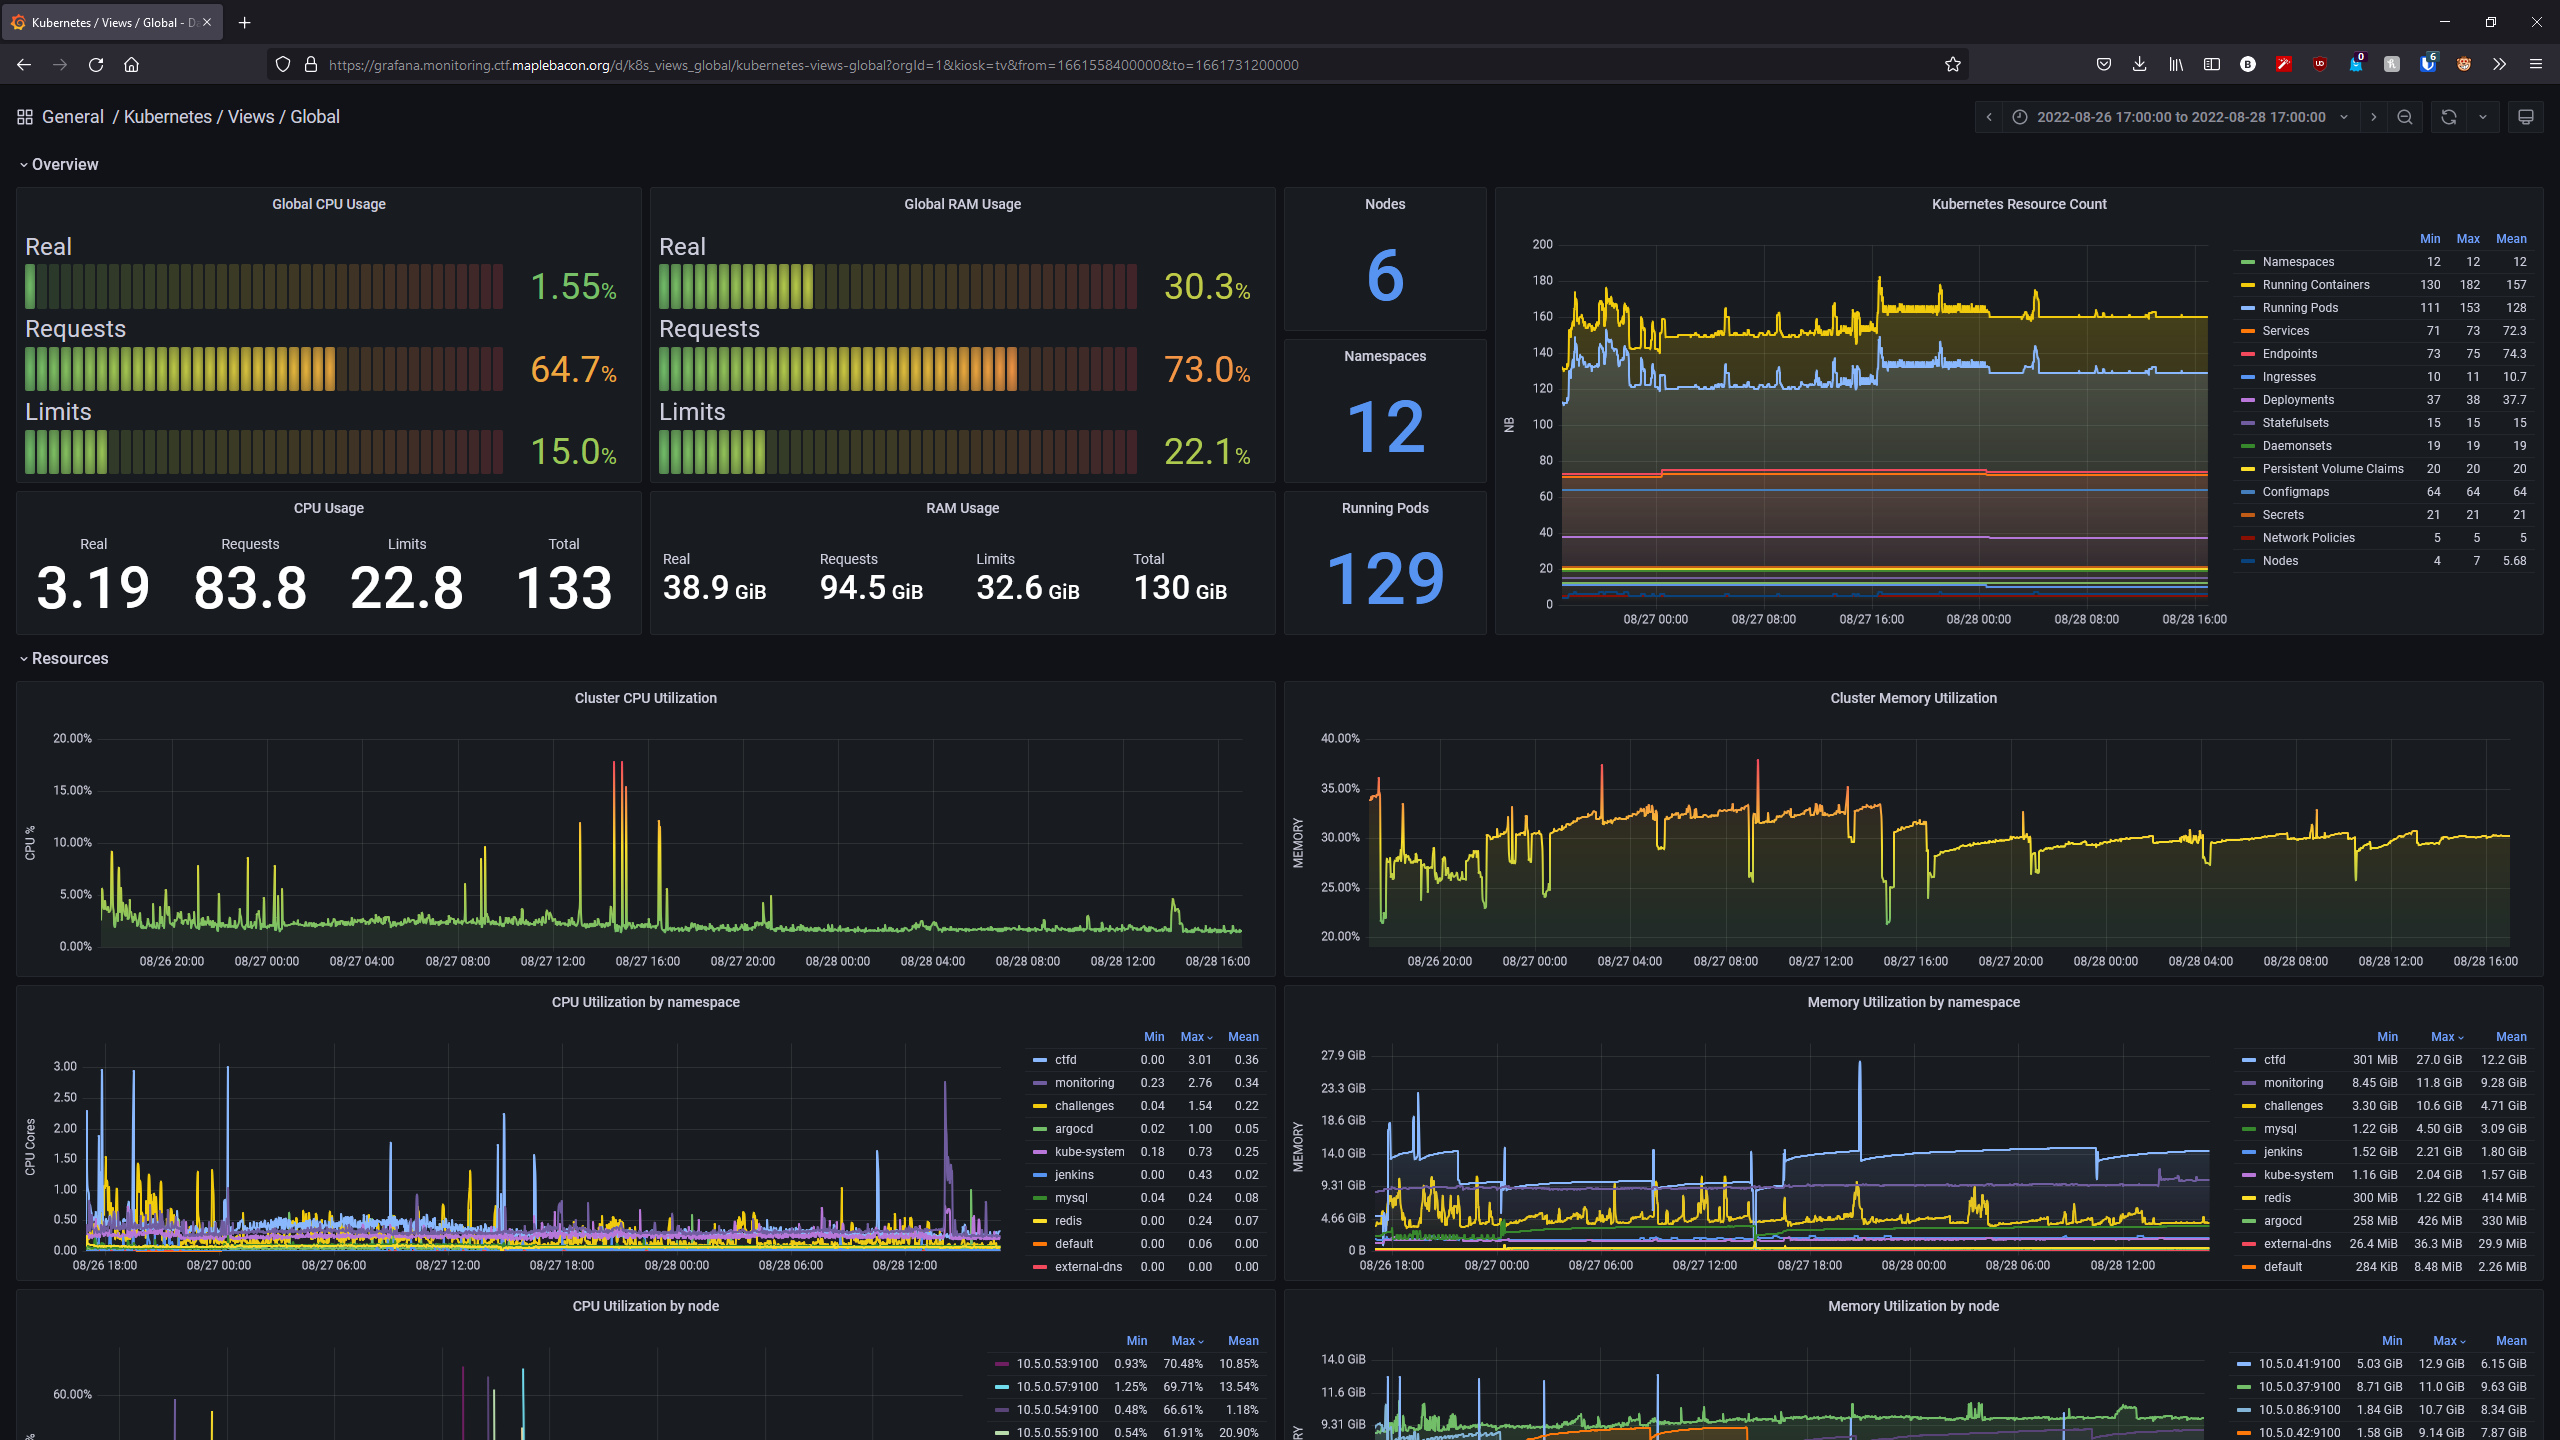
When you look at Grafana, you see that the CTF was VERY overprovisioned in terms of real CPU and memory usage.
Why I brought up my own logging stack
I brought up this logging stack because GKE logging is expensive.
Logging ingestion @ $0.50/GiB, with the first 50GiB free.
Before disabling GKE logging in testing, I used 21 GB in a few days with minimal traffic! While the price charged also includes their analytics, dashboards, and storage, running my own stack was cheaper.
Storage is typically very expensive on the cloud. Excluding CPU and memory costs, I deployed a 100GB balanced volume for logging purposes which was sufficient for this CTF.
If you look at disk pricing, you will see that for 100GB of logs, bringing up your own stack is much cheaper:
Cloud Logging: 100GB - 50GB (free) = $0.50/GB * 50GB = $25
GCP Balanced provisioned space (us-west1): $0.1/GB/month * 100GB = $10/month
Cost of the CTF
Running MapleCTF for two days was fairly reasonable. Our total cost came down to $181.33

What I would do differently for the next time
The infrastructure setup for MapleCTF 2022 wasn’t perfect.
We had some downtime on CTFd at the beginning of the CTF due to the underprovisioning of resources as well as a number of updates to CTFd. I initially underprovisioned the nodes required for the beginning of a CTF, so for next time I will adjust the number of replicas and nodes CTFd runs on, at least for the start of the CTF. I also won’t make the mistake of using the Recreate update strategy for CTFd.
Having the challenges be completed very late resulted in no time to test the challenges. Because it was my first time running a fairly big CTF, I did not know what to expect load wise. This resulted in the overprovisioning of resources for the nodes that ran the challenges. I could have reduced the costs by at least 1/3 based on the metrics shown. Look at the following Grafana dashboard to see how badly overprovisioned this CTF was.

At a period of low usage, I had 1 node for CTFd running and 3 nodes for the challenges. Looking back at this, we could have easily ran all of the challenges on less nodes.
Closing Thoughts
Overall, despite some issues I think we did well in running our first international CTF.
As a DevOps engineer, I am definitely aware of what I need to change for the next iteration of MapleCTF. I would love to have a chat with people about running CTFs on infrastructure that is maintainable, scalable, and cost efficient.
Feel free to contact me on Twitter if you want to chat!
